Symbolication: Beyond the basics
 Federico Zanetello
Description: Discover how you can achieve maximum performance and insightful debugging with your app. Symbolication is at the center of tools such as Instruments and LLDB to help bridge the layers between your application’s runtime and your source code. Learn how this process works and the steps you can take to gain the most insight into your app.
What is symbolication?
Mechanism to convert/translate how our devices see our apps at runtime — which is in terms of memory addresses and instructions — back to how we as developers see our apps — which is in terms of functions, names, and files.
A crash without symbols just tell us that a crash occurred, to make sense of it we need to reprocess the crash log with the build dSYM.
Thanks to dSYM, Xcode applies the concepts of symbolication, so that I can diagnose the issue with a much nicer crash log, where I can not only see all of my functions actually being called, but I can also determine the file and line number to refer back to in my code.
Alternatively, If I already have the dSYM, I can use the atos command to get the same information:
atos -o MyApp.dSYM/Contents/Resources/DWARF/MyApp -arch arm64 -l 0x10045c000 -i 0x16045fb70
Two-steps process for symbolication
- Going back to the file - here we convert/translate runtime memory addresses into a more stable, usable form
- Consult debug information
Going back to the file
Goal: translate a runtime memory address to a corresponding address in your binary on disk (a.k.a. file addresses)
On disk address space
Your app has an address space on disk.
- assigned by the linker
- the linker groups the file into segments
- each segment has certain properties, such as a name, a size, and their assigned addresses
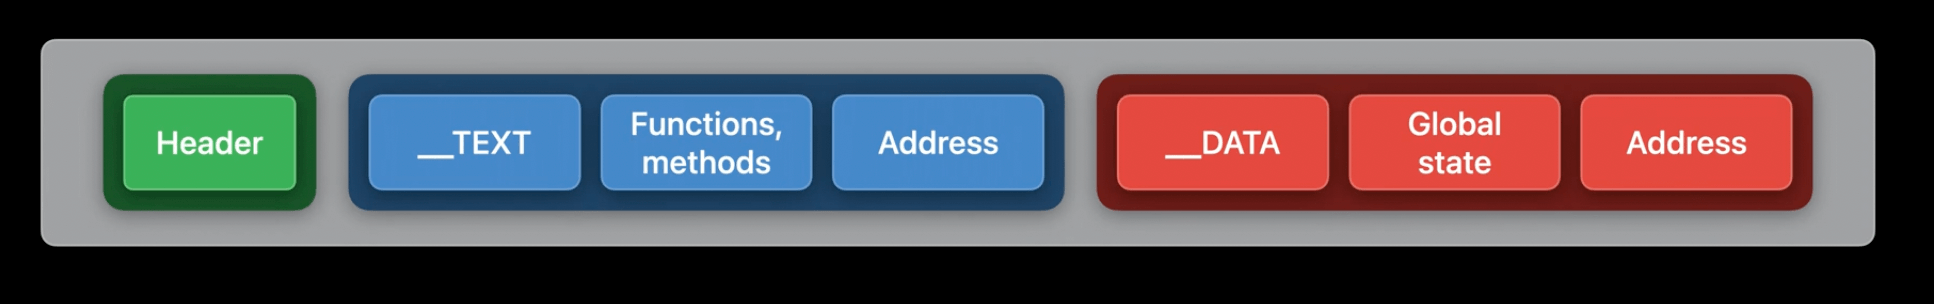
__TEXTsegment of your binary contains all of the functions and methods you've written__DATAsegment contains program-wide state such as global variables- each of these segments gets assigned a different address such that they don't overlap
- the linker records this information at the very beginning of your executables as part of the Mach-O header
Mach-O
Mach-O is the format used for all executable binaries and libraries, and the system knows that it needs to read this header to run your apps.
- the Mach-O header contains a number of load commands that hold the segment properties
- the system uses these load commands to load the segments into memory
- if your apps are Universal 2, then the app will have one header and a set of segments for each architecture
We can inspect these load commands by using otool -l in the terminal, which prints the load commands for a specified file
ASLR slide
Before the kernel actually loads the segments, it initializes a random value known as the ASLR slide
- this is to randomize the addresses values, it's a safety feature
- all runtime addresses will be shifted by this ASLR slide
- the difference between a runtime address and the linker address is the ASLR slide
- we can always go back to the file address space once we know the ASLR slide
Crash example
This is the crash report that we will use in this session:
Thread 0 Crashed:: Dispatch queue: com.apple.main-thread

0 MyApp                    0x000080010045fb70 0x16045c600 + 15216
1 libdyld.dylib            0x000008018248d420 start + 423

Thread 0 crashed with ARM Thread State (64-bit):
  xO: 0x0000000159e113a0 x1: 0x0000080000080103 x2: 0x0000000000000103 x3: 0x00000001ed6a1608
  x4: 0x0000090159e11300 x5: 0x0000000000000004 x6: 0x1b56e56ab0142e5a x7: 0x0000000000000000
  x8: 0x000009006006000a x9: 0x0000000159e11308 x10: 0x0600800000008054 x11: 0x0080000008179f41
  x12: 0x0000000159000000 x13: 0x00000000770b8226 x14: 0x00000000770b8201 x15: 0x00000000000625eb
  x16: 0x000000018e48ee2c x17: 0x00000001f0cbfe70 x18: 0x0000000000090999 x19: 0x0000000159e111b0
  x20: 0x000000016ef26940 x21: 9x0000000800000000 x22: 0x0000000000008888 x23: 0x000000000009d0
  x24: 0x0000009000008600 x25: 0x0000000000000800 x26: 0x0000600880000000 x27: 0x0000000000000000
  x28: 0x000600016ef2b930 fp: 04000000016ef2b970 lr: 0x0000000100ed7a50
  sp: 0x000000016ef2b930 pc: 0x0000080100ed7ae0: cpsr: 0x80000000
  far: 0x000001ed8b3068 esr: 0xf2000001

Binary Images:
  0x10045c000 - 0x10045ffff +MyApp  /Users/USER/MyApp
Computing the ASLR slide
The ASLR slide equation requires two addresses:
- the load address
- the linker address
ASLR slide + linker address = load address
We can get the load address by looking at the mach-o load commands via otool.
To know the runtime address, the system queries your app either at the point of a crash, or as its being profiled by Instruments for its runtime address space.
You can also see the load addresses interactively with the
vmmaptool, which enumerates the active memory regions in your program
We can see the load address from the crashlog (0x10045c000, in the Binary images section):
0x10045c000 - 0x10045ffff +MyApp
We can see the linker address from otool (0x0000000100000000 or 0x100000000):
$ otool -l MyApp | grep LC_SEGMENT -A8

     cmd LC_SEGMENT_64      # segment load command
 cmdsize 712
 segname __TEXT             # name and
  vmaddr 0x0000000100000000 # address
  vmsize 0x0000000000004000 # range
 fileoff 0
filesize 16384
 maxprot 0x00000005
initprot 0x00000005
Subtracting these two yields (0x10045c000 - 0x100000000) an ASLR slide value of 0x45c000
- This means that every address in my program's runtime
__TEXTsegment is0x45c000bytes away from the linker__TEXTsegment address
Back to the file address space
Now that we have the ASLR slide value, we can see what a backtrace address from the crash log corresponds to in the file:
Thread 0 Crashed:: Dispatch queue: com.apple.main-thread
0 MyApp              0x000000010045fb70 0x10045c000 + 15216
ASLR slide = 0x45c000
Backtrace address = 0x000000010045fb70
0x10045fb70 - 0x45c000 = 0x100003b70
0x100003b70 is the address on disk
Since this address is now part of the on-disk address space, I can inspect my app to see what resides there.
We can use otool too see where the crash occurred:
otool -tV MyApp -arch arm64
This will print the disassembly where the crask occurred:
// ASLR slide = 0x45c000
// 0x10045fb70 - 0x45c000 = 0x100003B70

0000000100003b6c      ret
0000000100003670      brk #0x1
brksignals an exception or a problem in the app
Other ways to calculate ASLR slide:
atoswill read the load commands for the file segment address indicated by the-oflag, and we tell it about the load address with the-lflag
vmmapcan also tell us about the load addresses of a running app (run this before it crashes)
vmmap MyApp | grep __TEXT
Debug information
- created during build
- either embedded directly into your app binaries, or stored as a separate file, such as a
.dSYM
- There are different categories/types of debug info
- each offers a different level of detail for a given file address:
| Function addresses | Function names | File and line numbers | Optimizations | |
|---|---|---|---|---|
| Function starts | ✅ | ❌ | ❌ | ❌ |
| Nlist symbol table | ✅ | ✅ | ❌ | ❌ |
| DWARF | ✅ | ✅ | ✅ | ✅ |
- Since DWARF offers the most detail, we really want to strive to have this type of debug info whenever possible
Function starts
- offers the least source code detail
- only tells us about the first address — or the literal start — of our functions
- this would tell us that a function begins and exists at a certain address. However, it doesn't tell us which functions begin at those addresses, only that they exist
The function starts debug info does this by encoding the list of addresses in your app's __LINKEDIT segment.
Since this is embedded directly in your app, the Mach-O header also has a load command to inform us where we can find it, which is LC_FUNCTION_STARTS.
We can obtain the function starts with the symbols command and the -onlyFuncStartsData flag
symbols -onlyFuncStartsData -arch arm64 MyApp
0x0000000100003a68 (    0x3c4) TEXT _text
  0x0000000100003a68 (   0x10c) (null) [FUNC, FunctionStarts]
  0x0000000100003674 (    0x3c) (null) [FUNC, FunctionStarts]
  0x0000000100003bb0 (   0x114) (null) [FUNC, FunctionStarts]
  0x0000000100003cc4 (    0x40) (null) [FUNC, FunctionStarts]
  0x0000000100003d04 (    0x98) (null) [FUNC, FunctionStarts]
  0x0000000100003d9c (    0x8c) (null) [FUNC, FunctionStarts]
  0x0000000100003e28 (     0x4) (null) [FUNC, FunctionStarts]
Here we get back a list of addresses and null placeholders
These placeholders would ideally have function and method names instead of null, but the function starts data doesn't provide names.
However, it does allow for a slight update to the crash log.
We can now view the file addresses as offsets from a function.
For example:
Thread 0 Crashed:: Dispatch queue: com.apple.main-thread
0 MyApp              0x000000010045fb70 0x10045c000 + 15216
- first we go back to the file by subtracting the ASLR slide value:
Thread 0 Crashed:: Dispatch queue: com.apple.main-thread
0 MyApp              0x100003b70 0x100003a68 + 264
- Then we find the function starts value that could contain the file address:
0x0000000100003a68 (    0x3c4) TEXT _text
  0x0000000100003a68 (   0x10c) (null) [FUNC, FunctionStarts] // 👈🏻
  0x0000000100003674 (    0x3c) (null) [FUNC, FunctionStarts]
  ...
In this case, only the first value could contain the address because all of the other values are larger than the address.
- Finally we can claim that our file address is actually 264 bytes into this function
This is primarily useful for debuggers, since they can understand the details of how this function was set up and which registers were modified.
This is all we get from Function starts.
Nlist symbol table
- builds on the idea of function starts
- encode a list of information in the
__LINKEDITsegment (described byLC_SYMTAB) - more than just encoding addresses, they encode
nlist_62C structs
struct nlist_64 {
  union {
    uint32_t  n_strx;
  } n_un;
  uint8_t n_type; // Determines values and properties
  uint8_t n_sect;
  uint16_t n_desc;
  uint64_t n_value;
};
There are two primary n_types:
- direct symbols
- indirect symbols
The way we distinguish them is via n_type value:
- direct symbols:
000001110- second, third, and fourth least significant bits set- this bit pattern is also known as
N_SECT(0xe)
- indirect symbols:
000000001- only the least significant bit is set- this bit pattern is also known as
N_EXT(0x01)
Direct symbols
- functions and methods defined in your apps and frameworks
- have a name and address in the
nlist_64struct
We can list all direct symbols via nm (nm stands for name - it's the display symbol name list tool):
nm -arch arm64 --defined-only --numeric-sort MyApp
Output:
0000000100000000 T __mh_execute_header 0000000100003a68 T _main
0000000100003674 t ___swift_instantiateConcreteTypeFromMangledName
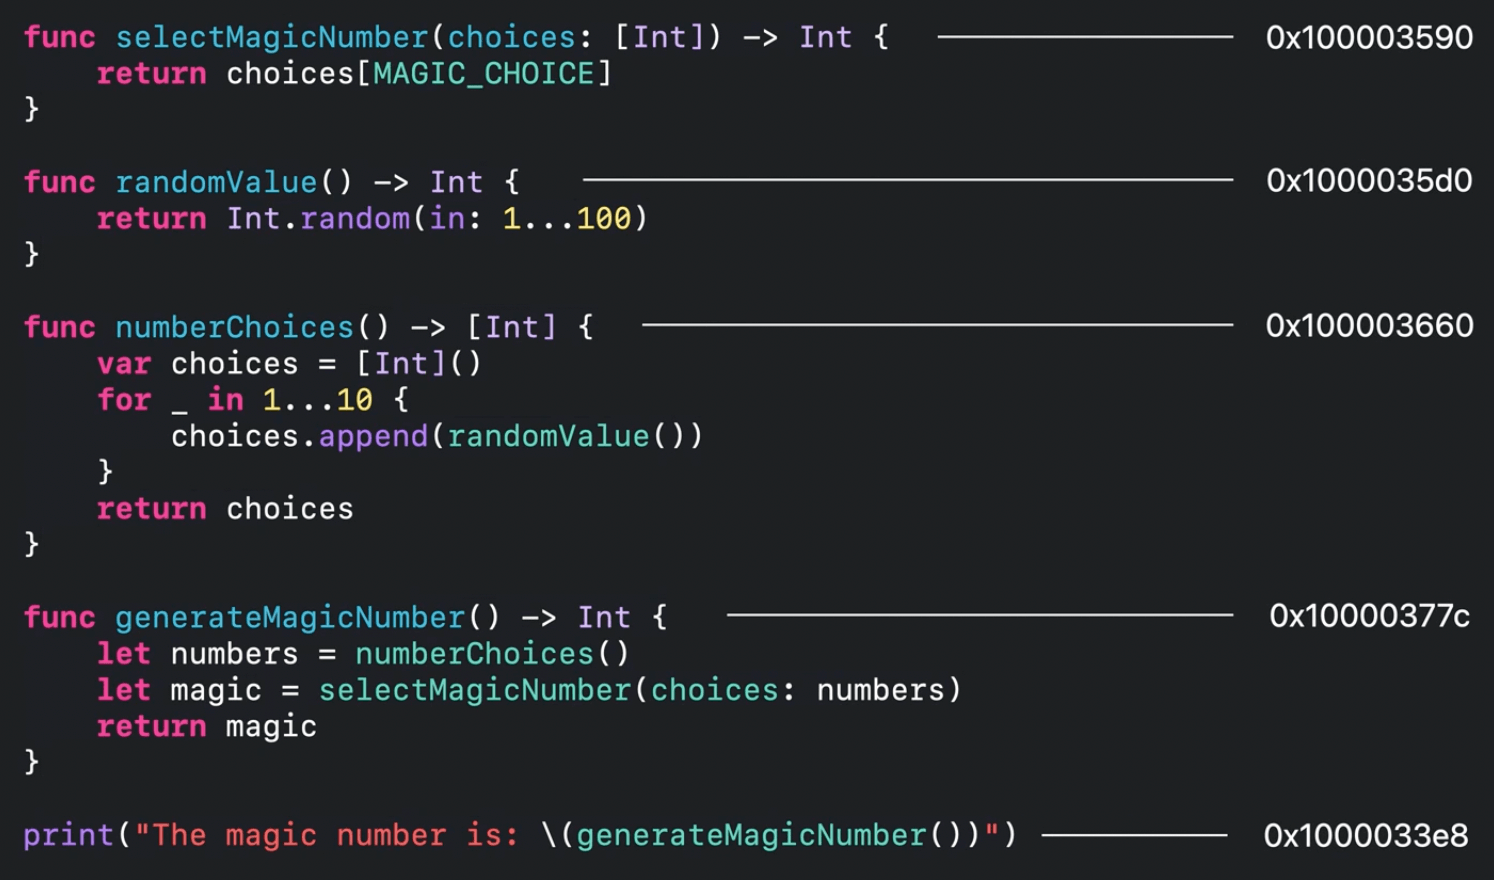
0000000100003bb0 t _$s12MyApp13numberChoicesSaySiGyF
0000000100003cc4 t _$sS2iSzsWl
0000000100003d04 t _$ss12_ArrayBufferV20_consumeAndCreateNew14bufferIsUnique15minimumCapacity
0000000100003d9c t _$ss22_ContiguousArrayBufferV19_uninitializedCount15minimumCapacityAByxGSi
0000000100003e28 t __swift_stdlib_malloc_size
0000000100003ef0 s ___swift_reflection_version
nmwalked through the defined symbols of the app program and listed them in address order- the names stored in the symbol tables are mangled names
- these mangled names help the compiler and linker to uniquely identify a function, but they aren't easy to understand unless they're demangled
For a better output, we can pass nm output to swift-demangle:
nm -arch arm64 —defined-only --numeric-sort MyApp | xcrun swift-demangle
Output:
0000000100000000 T __mh_execute_header
0000000100003a68 T _main
0000000100003674 t ___swift_instantiateConcreteTypeFromMangledName
0000000100003bb0 t MyApp.numberChoices() -> [Swift.Int]
0000000100003cc4 t lazy protocol witness table accessor for type Swift.Int and conformance Swift
0000000100003d04 t t generic specialization  of Swift._ArrayBuffer._consumeAndCreateNew.Bool) -> Swift._ArrayBuffer
symbols tool also has an option to show Nlist data, it demangles names automatically:
symbols -arch arm64 -onlyNListData MyApp
0x0000000100003a68 (0x3c4) _TEXT __text
  0x0000000100003a68 (  0x10c) main [FUNC, EXT, NameNList, MangledNameNList, Merged, List, FunctionStarts]
  0x0000000100003b74 (   0x3c) __swift_instantiateConcreteTypeFromMangledName [FUNC, PEXT, NameNList, MangledNameNList
  0x0000000100003bb0 (  0x114) numberChoices () [FUNC, PEXT, NameNList, MangledNameNList, Merged, NList, FunctionStarts
  0x0000000100003cc4 (   0x40) lazy protocol witness table accessor for type Int and conformance Int [FUNC, PEXT, Name
  0x0000000100003d04 (   0x98) specialized _ArrayBuffer._consumeAndCreateNew(bufferIsUnique:minimumCapacity:growForApp
  0x0000000100003d9c (   0x8c) specialized _ContiguousArrayBuffer.init(_uninitializedCount:minimumCapacity:)[FUNC,PE
  0x0000000100003e28 (    0x4) _swift_stdlib_malloc_size [FUNC, NameNList, MangledNameNList, Merged, NList, FunctionSt
Going back to our crashlog:
Thread 0 Crashed:: Dispatch queue: com.apple.main-thread
0 MyApp              0x100003b70 0x10003a68 + 264
Here we can observe that our offset expression (0x10003a68 + 264) that we got from the function starts data also matches an entry from the direct symbols. That entry has a name:
0x0000000100003a68 ( 0x10c) main
Putting these two together, we can now say that our crash happened at 264 bytes into main:
Thread 0 Crashed:: Dispatch queue: com.apple.main-thread
0 MyApp              0x100003b70 main + 264
This still doesn't tell us a lot, because direct symbols have some limitations such as missing some functions names.
One reason for this is that the symbol table only has direct symbol entries for functions that are involved in linking:
- these are functions that you use across modules or functions that you export from your frameworks
- this makes it useful for identifying API boundaries
- it has the necessary data to power dynamic loading with functions such as
dlsym()anddladdr()
Direct symbols gaps in information:
- local, static functions are not represented
- can omit implementation functions
- stripped in release configurations
- primary app executables left practically empty
- helps reduce the size of our app
- frameworks left with only exported functions
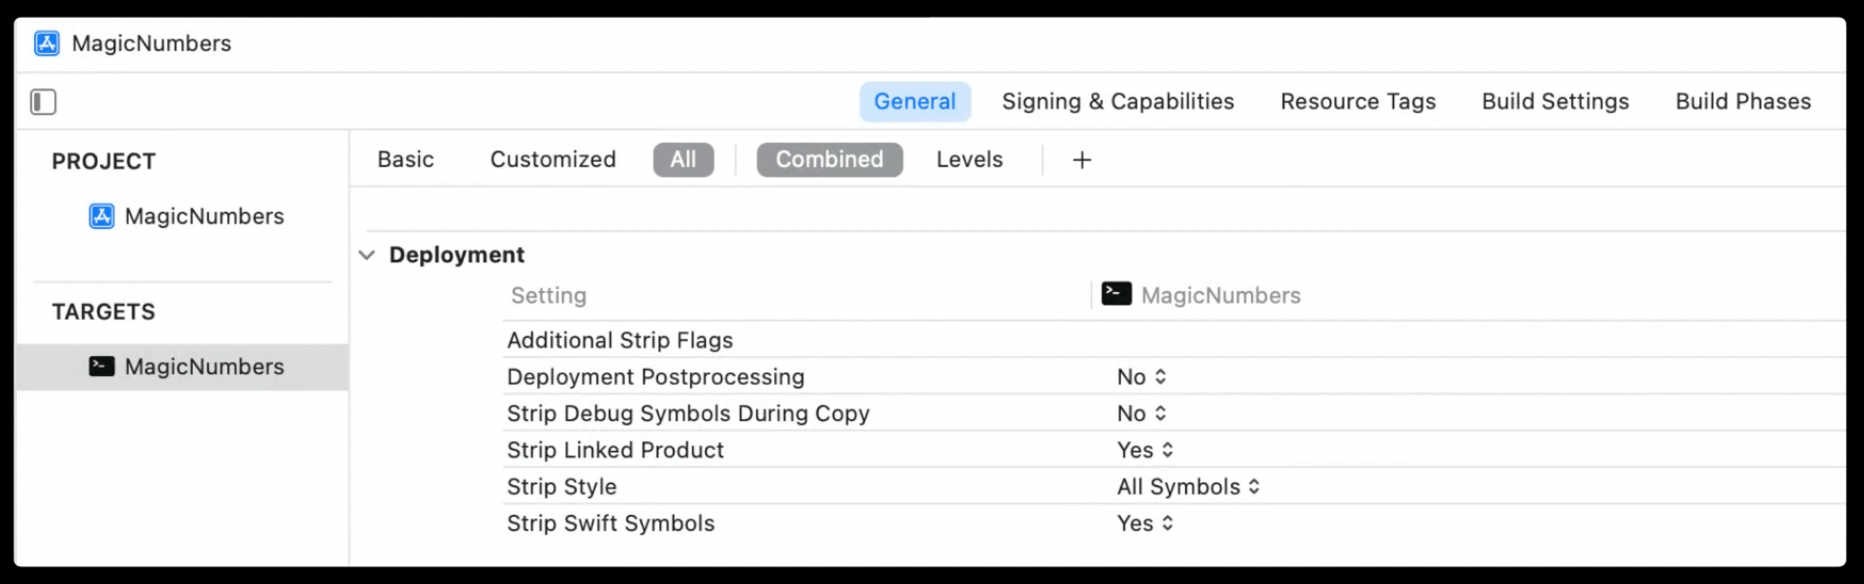
Xcode has various build settings around stripping symbols such as:
Strip Linked Product- if enabled, then the binary is stripped according to Strip StyleStrip Style- three options:- All Symbols - Most invasive; preserve essentials
- Non Global - Remove locally shared functions
- Debugging Symbols - Remove debug list entry, keep direct symbols
Indirect symbols
These are functions and methods that you're using from other frameworks or libraries, such as print()
You can see them via nm:
nm -m —arch arm64 --undefined-only --numeric-sort MyApp
the
mflag asksnmto print from which frameworks the symbols come from
(undefined) external Swift._allocateUninitializedArray(Builtin.Word) -> ([A], Builtin.RawPointer) (from libswiftCore)
(undefined) external Swift.print(_:
Any..., separator: Swift.String, terminator: Swift. String) -> () (from libswiftCore)
(undefined) external type metadata for Any (from libswiftCore)
Function starts, nlist recap
Function starts are a list of addresses (they lack names, but do allow us to determine offsets)
NList symbols tables:
- add names to addresses
- direct and indirect symbols
- reserved for functions involved in linking
- strip build settings influence which direct symbols are available.
Both are embedded in __LINKEDIT (in debug mode)
What we haven't seen yet is the richer levels of detail, such as file names and line numbers. This is provided to us by DWARF.
DWARF
- DWARF strives to describe everything
- DWARD adds relationships to nlist symbols data
- primarily found in dSYM bundles
When we're analyzing DWARF, we're primarily referring to a dSYM bundle.
In addition to other metadata such as plists, the dSYM bundle contains a binary with DWARF.
DWARF binary
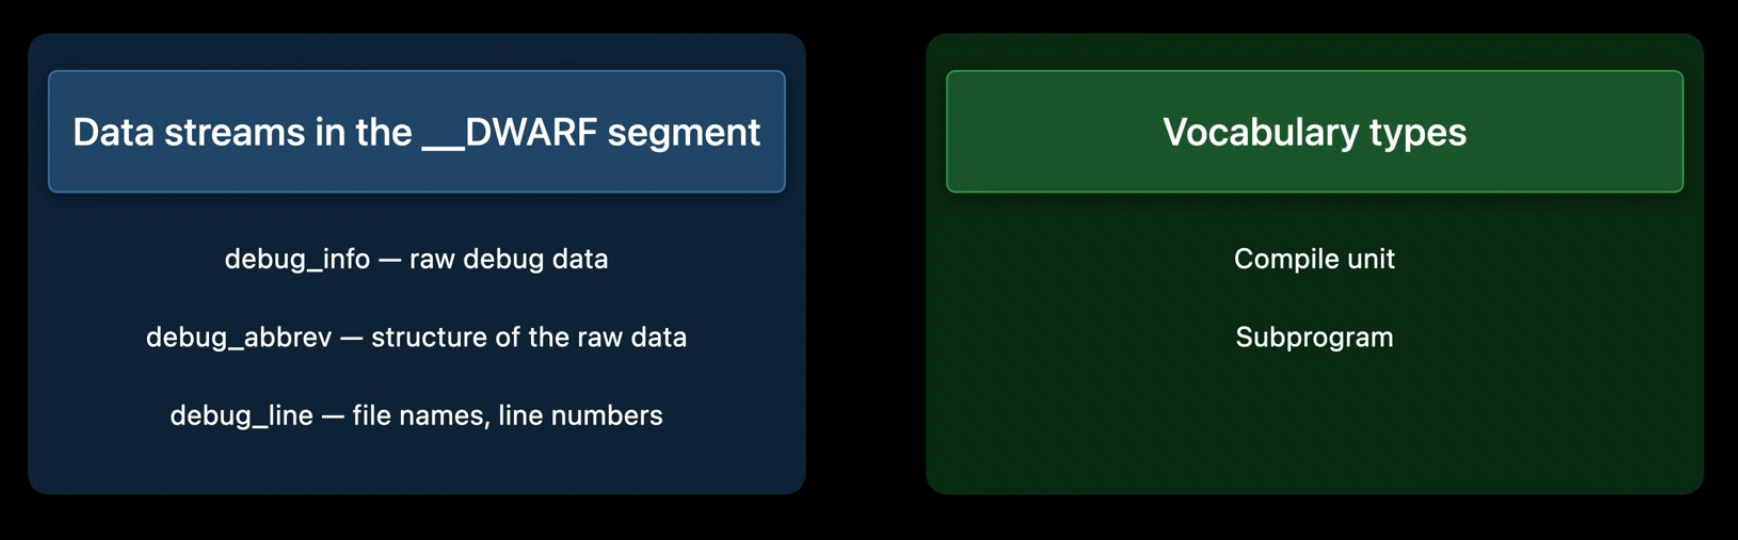
The DWARF specification mentions three streams of data within the segment:
debug_infocontains the raw datadebug_abbrevassigns structure to the datadebug_linecontains the file names and line numbers
DWARF also defines two vocabulary types:
- the compile unit
- a single source file that went into building the product
- contains assigned attributes and properties (name of the file, the SDKs, the portion of the
__TEXTsegment its functions occupy, and much more)
- the subprogram
- represents a defined function
- not limited to exported or shared functions
- name and
__TEXTsegment range - defined in compile units
- DWARD represents this with a tree
We can observe this in detail with the dwarfdump command:
dwarfdump -v -debug-info -arch arm64 MyApp.dSYM
DW_TAG_compile_unit [154] *
  DW_AT_producer [DW_FORM_strp]    (.debug_str[0x000b656e] = "Apple Swift version 5.5 (swiftlang-1300.0.16.7 clang-1300.0.18.1)")
  DW_AT_language [DW_FORM_data2]   (DW_ LANG Swift)
  DW_AT_name [DW_FORM_strp] ( .debug_str[0x000b65b0] = '/Users/USER/Projects/MyApp/main.swift")
  DW_AT_stmt_list [DW_FORM_sec_offset] (0x0000a7be)
  DW_AT_comp_dir [DW_FORM_strp] debug_st[0x000b65f2] = "/Users/USER/Projects/MyApp")
  DW_AT_APPLE_optimized [DW_FORM_flag_present] (true)
  DW_AT_APPLE_major_runtime_vers [DW_FORM_data1] (0x05)
  DW_AT_low_pc [DW_FORM_addr] (0x0000000100003a68)
  DW_AT_high_pc [DW_FORM_data4] (0x000003c0)
dwarfdump helpfully combines the debug_ info and debug _abbrev contents to show you the structure and content of the data in your dSYMs.
File names and line numbers come from the debug_line stream
- this stream defines a line table program where the individual file addresses can be mapped back to an exact line of code
- generates a list of source code details which we can search to find the file and line
Given a crash log and a DWARF, we can map back to the specific line of code where the crash has happened via atos:
atos -o MyApp.dSYM/Contents/Resources/DWARF/MyApp -arch arm64 —l 0x10045c000 0x10045fb70
Output:
main (in MyApp) (main.swift:36)
DWARF also takes care of inline functions
DWARF recap
- function and file relationships
- inlined functions impact the quality of symbolication (DWARF can take care of this)
- can be found in dSYMs and static libraries (prefer dSYM, as you can easily transfer them to others and have built-in support from several tools)
Tools and tips
- in Xcode build settings, make sure that the
Debug Information Formatis set toDWARF with dSYM Filefor your Release mode - you can download your dSYMs through App Store Connect
If you want to check that a certain dSYM is already on your device, you can use the mdfind command
mdfind "com_apple_xcode_dsyms_uuids == C061EE83-B61D-3352-8EE5-655491DB1D16" /User/USER/Documents/MyApp.dSYM
the alphanumeric string here is your binary's UUID, which is a unique identifier defined in a load command
You can see the UUID for your dSYMs with symbols -uuid:
symbols -uuid MyApp.dSYM
The app's UUID is in the Binary Images list section of crash reports and you can also see it with the symbols command:
symbols -uuid MyApp
A toolchain could generate invalid DWARF. You can check this with:
dwarfdump —verify MyApp.dSYM
You can use symbols to check the types of debug information your app has available:
symbols -arch arm64 MyApp
Output:
0x0000000100003a68 (  Ox10c) main [FUNC, EXT, LENGTH, NameNList, MangledNameNList, Merged, NList, Dwarf, FunctionStarts] # 👈🏻
  0x0000000100003a68 (   0x74) main. swift:0
  0x0000000100003adc (    0x4) main. swift:29
  0x0000000100003ae0 (   0x44) :0
  0x0000000100003638 (   0x14) main.swift:36
  0x0000000100003624 (   0x38) main.swift:36
  0x0000000100003b70 (    0x4) :0
0x0000000100003674 (   0x3c) __swift_instantiateConcreteTypeFromMangledName [FUNC, OMIT-FP, PEXT, LENGTH, NameDwarfMIPSLinkag. # 👈🏻
  0x0000000100003674 (   0x3c) :0
0x0000000100003bb0 (  0x114) numberChoices () [FUNC, PEXT, LENGTH, NameDwarfMIPSLinkage, MangledNameNList, Merged, NList, Dwar.
these tags in square brackets tell you the information source
Verify entitlements
If you're certain that you have dSYMs available but still aren't getting names for your functions in Instruments traces, check your entitlements and code signing:
codesign --display -v --entitlements :- MyApp.app
Format=app bundle with Mach-O universal (×86_64 arm64)
CodeDirectory v=20500 size=909 flags=0x10000 (runtime) hashes=17+7 location=embedded
Signature size=4810                     # 👈🏻
Signed Time=May 15, 2021 at 4:46:02 PM  # 👈🏻
Info.plist entries=23                   # 👈🏻
TeamIdentifier=59GAB85EFG               # 👈🏻
Runtime Version=12.0.0
Sealed Resources version=2 rules=13 files=4
Internal requirements count=1 size=200
<?xml version="1.0" encoding="UTF-8"?>
<!DOCTYPE plist PUBLIC "-//Apple//DTD PLIST 1.0//EN" "https://www.apple.com/DTDs/PropertyList-1.0.dtd">
<plist version= "1.0">
  <dict>
    <key>com.apple.security.app-sandbox</key>
    <true/>
    <key>com.apple-security.get-task-allow</key> # 👈🏻
    <true/>                                      # 👈🏻
    ...
You should also verify that locally built apps for development have the get-task-allow entitlement.
This entitlement grants permissions to tools such as Instruments to symbolicate your app.
If you don't have the get-task-allow entitlement enabled, you should check your Code Signing Inject Base Entitlements build setting and make sure that it's enabled as you're developing.
DWARF size limits
- limited to 4GB
- consider splitting the project into separate components/modules so that each one has its own smaller dSYM
 GitHub
 zntfdr.dev